Comprehensive Analysis of SPY: Unveiling Trends, Fundamentals, and Technical Indicators

Introduction:
The SPDR S&P 500 ETF Trust (SPY) is one of the most widely traded exchange-traded funds (ETFs), offering investors exposure to the performance of the S&P 500 index. In this analysis, we delve into various aspects of SPY, including its historical performance, underlying fundamentals, and key technical indicators, to provide investors with a comprehensive understanding of this prominent ETF.
Historical Performance:
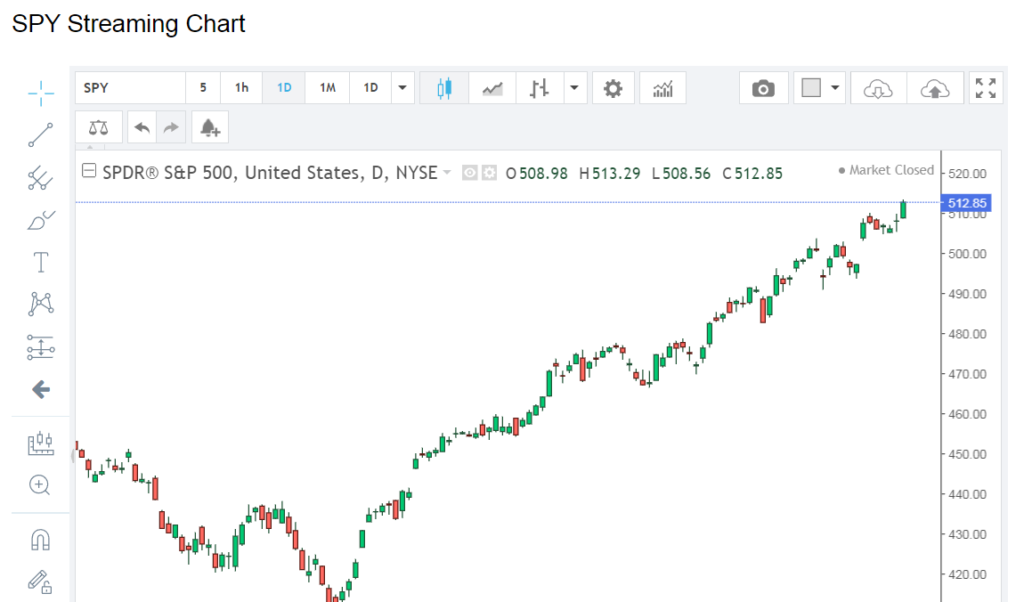
SPY has consistently been a preferred choice for investors seeking broad market exposure, tracking the performance of the S&P 500 index, which comprises 500 of the largest publicly traded companies in the United States. Over the years, SPY has delivered competitive returns, mirroring the overall trajectory of the U.S. stock market. By analyzing historical price data and performance metrics, we can gain insights into SPY’s long-term trends and volatility.
Fundamental Analysis:
Fundamental analysis plays a vital role in evaluating the intrinsic value of SPY and assessing its potential for long-term growth. Key fundamental metrics include the price-to-earnings (P/E) ratio, price-to-book (P/B) ratio, dividend yield, and earnings per share (EPS) growth. By comparing these metrics against historical averages and industry benchmarks, investors can gauge whether SPY is overvalued, undervalued, or fairly priced.
Market Environment:
Understanding the broader market environment is essential for analyzing SPY’s performance. Factors such as economic indicators, monetary policy decisions, geopolitical events, and market sentiment can influence the direction of the stock market and, consequently, SPY’s performance. By staying abreast of macroeconomic trends and market dynamics, investors can make informed decisions regarding their SPY investments.
Technical Indicators:
Technical analysis involves studying price charts and applying various technical indicators to identify trends, support and resistance levels, and potential entry and exit points. Common technical indicators used in analyzing SPY include moving averages, relative strength index (RSI), moving average convergence divergence (MACD), and Bollinger Bands. By incorporating these indicators into their analysis, traders can gain insights into SPY’s short-term price movements and identify trading opportunities.
Risk Management:
Effective risk management is crucial for investors and traders alike, especially when dealing with volatile instruments like SPY. Risk management strategies include setting stop-loss orders, diversifying portfolios, and allocating capital based on risk tolerance and investment objectives. By implementing disciplined risk management practices, investors can mitigate potential losses and protect their investment capital.
Outlook:
The outlook for SPY depends on a multitude of factors, including macroeconomic conditions, corporate earnings, and investor sentiment. While past performance may provide insights into future trends, it’s essential to exercise caution and conduct thorough analysis before making investment decisions. By staying informed and adapting to changing market conditions, investors can navigate the uncertainties of the stock market and potentially capitalize on opportunities presented by SPY.
Conclusion:
In conclusion, SPY remains a popular choice for investors seeking exposure to the broader U.S. stock market. Through a combination of fundamental analysis, technical analysis, and risk management, investors can gain insights into SPY’s performance and make informed investment decisions. While there are inherent risks associated with investing in ETFs like SPY, diligent research and disciplined execution can help investors navigate the complexities of the stock market and achieve their financial goals.
This analysis provides investors with a comprehensive overview of SPY and its potential implications for their investment portfolios.


