Dow or Nasdaq: Full Analysis for 15th July 2024
In the ever-evolving landscape of financial markets, understanding the nuances between the Dow Jones Industrial Average (DJIA) and the Nasdaq Composite Index is crucial for investors and analysts alike. As of July 15, 2024, both indices are navigating through a maze of economic indicators, corporate earnings, and market sentiment. This comprehensive analysis delves into the performance, key drivers, and technical outlook for the Dow and Nasdaq, providing valuable insights for market participants.
Overview of Dow Jones Industrial Average (DJIA)
The Dow Jones Industrial Average (DJIA), often referred to simply as the Dow, is a stock market index that tracks 30 large, publicly-owned companies trading on the New York Stock Exchange (NYSE) and the NASDAQ. It is one of the most widely followed indices in the world, serving as a barometer for the overall health of the U.S. economy.
Current Performance and Key Drivers
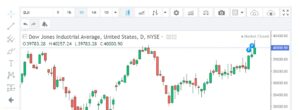
As of July 15, 2024, the DJIA closed at 40,000.90 points, reflecting a modest increase from the previous trading sessions. This performance can be attributed to several key factors:
- Corporate Earnings Reports: Major corporations such as Johnson & Johnson, Boeing, and Microsoft are set to release their quarterly earnings reports. Positive earnings surprises from these blue-chip companies could significantly boost the Dow. Conversely, any earnings misses could exert downward pressure on the index.
- Federal Reserve Policies: The latest jobs report showed a slowdown in job growth for June, with the unemployment rate rising to 4.1%. This has led to speculation that the Federal Reserve may consider cutting interest rates sooner than expected to support economic growth. Lower interest rates are generally bullish for equities, including the Dow, as they reduce borrowing costs for companies and encourage investment.
- Sector Performance: The Dow is heavily influenced by the performance of its constituent sectors. Recent gains in the industrial and consumer sectors have been significant, driven by robust economic data and strong corporate performance. However, tech-related stocks within the Dow have been more volatile, reflecting broader market trends.
Technical Analysis
From a technical perspective, the Dow is currently navigating key support and resistance levels. The index has strong support around the 39,500 mark, which has historically acted as a robust floor during market corrections. On the upside, breaking past the 40,200 level could signal further bullish momentum, potentially driving the index to new highs.
Support and Resistance Levels
- Support: 39,500
- Resistance: 40,200
Overview of the Nasdaq Composite Index
The Nasdaq Composite Index is a broad-based index that includes more than 3,000 companies listed on the Nasdaq stock exchange. It is heavily weighted towards technology and growth stocks, making it a key indicator of the tech sector’s health.
Current Performance and Key Drivers
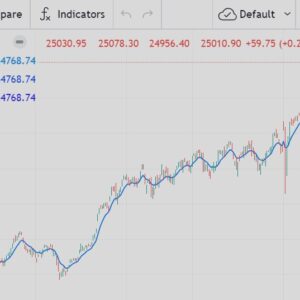
As of July 15, 2024, the Nasdaq Composite is trading at record highs, driven primarily by strong performances from major tech companies and positive sentiment surrounding the tech sector.
- Big Tech Performance: Companies like Tesla, Apple, and Amazon have seen substantial gains recently. Tesla, for instance, has rebounded sharply after a difficult start to the year, thanks to better-than-expected delivery numbers and renewed investor confidence. Similarly, Apple’s advancements in AI have bolstered its stock price significantly.
- Market Sentiment: Investor sentiment remains bullish for tech stocks, especially with increasing investments in artificial intelligence and innovative technologies. This optimism is helping to sustain the Nasdaq’s upward trajectory.
- Interest Rates and Inflation: Like the Dow, the Nasdaq is also sensitive to changes in interest rate expectations. The recent job report has led to speculation about potential rate cuts, which generally benefit high-growth tech stocks due to the lower cost of borrowing.
Technical Analysis
The Nasdaq is currently in a strong bullish trend. Key support levels are around 14,800, while resistance is noted near 15,500. Breaking through these levels could set the stage for further gains. Investors are advised to monitor these levels closely as they navigate their investment strategies.
Support and Resistance Levels
- Support: 14,800
- Resistance: 15,500
Comparative Analysis: Dow vs. Nasdaq
Market Composition
- Dow Jones Industrial Average: Comprises 30 large-cap companies across various sectors, including industrials, consumer goods, and technology. It is price-weighted, meaning companies with higher stock prices have a greater influence on the index’s movements.
- Nasdaq Composite: Includes over 3,000 companies, with a significant weighting towards technology and growth stocks. It is market-cap weighted, meaning companies with larger market capitalizations have a greater impact on the index.
Volatility and Risk
- Dow Jones Industrial Average: Generally considered less volatile due to its inclusion of established, blue-chip companies. It is often seen as a safer investment during periods of market uncertainty.
- Nasdaq Composite: Known for higher volatility, driven by its concentration in tech and growth stocks. While it offers greater potential for returns, it also carries higher risk, particularly during tech-sector downturns.
Historical Performance
Historically, the Nasdaq has outperformed the Dow during periods of strong economic growth and technological innovation. However, the Dow has shown greater resilience during economic downturns due to its diverse sector composition.
Outlook and Investment Strategies
Dow Jones Industrial Average
Investors in the Dow should focus on:
- Earnings Reports: Monitoring quarterly earnings from key constituents to gauge market sentiment and potential movements.
- Economic Indicators: Keeping an eye on macroeconomic data, such as job reports and inflation figures, which influence Federal Reserve policies.
- Sector Rotation: Paying attention to sector performance within the Dow, particularly shifts between cyclical and defensive sectors.
Nasdaq Composite
Investors in the Nasdaq should consider:
- Tech Sector Trends: Staying informed about developments in the tech industry, including advancements in AI, cybersecurity, and cloud computing.
- Interest Rates: Monitoring Federal Reserve actions on interest rates, as tech stocks are particularly sensitive to changes in borrowing costs.
- Market Sentiment: Gauging investor sentiment towards high-growth stocks and potential shifts in risk appetite.
Conclusion
The Dow Jones Industrial Average and the Nasdaq Composite offer unique opportunities and challenges for investors. The Dow provides stability and exposure to well-established companies, while the Nasdaq offers growth potential driven by technological innovation. As of July 15, 2024, market participants should remain vigilant of economic indicators, corporate earnings, and sector-specific trends to navigate the complexities of these indices effectively.
For those looking to maximize their investment strategies, understanding the distinct characteristics and drivers of the Dow and Nasdaq is essential. By staying informed and adaptable, investors can better position themselves to capitalize on the opportunities presented by these key market indices.


