Dow or Nasdaq: Full Analysis for 28th June 2024

Introduction
As we approach the trading day of June 28th, 2024, investors and analysts are closely monitoring the Dow Jones Industrial Average (Dow) and the Nasdaq Composite Index (Nasdaq). These indices are critical benchmarks in the global financial markets, representing different sectors and market dynamics. This article provides a comprehensive analysis and forecast for both indices, leveraging technical indicators, historical trends, and current market conditions.
Current Market Overview
Dow Jones Industrial Average (Dow)
The Dow Jones Industrial Average, consisting of 30 large, publicly-owned companies, closed at 39128 points in the previous session. This index is heavily influenced by sectors such as technology, financials, and consumer goods, with prominent companies like Apple, Microsoft, and JP Morgan impacting its performance. Recent market sentiment has been buoyed by positive economic data and corporate earnings reports.
Nasdaq Composite Index (Nasdaq)
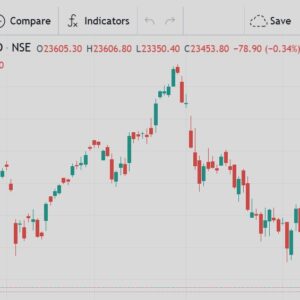
Conversely, the Nasdaq Composite Index, which includes more than 3,000 stocks, predominantly from the technology and biotechnology sectors, concluded at 17812 points. Leading tech firms such as Amazon, Google (Alphabet), and Tesla are pivotal in shaping Nasdaq’s movements, driven by innovation cycles and global tech trends.
Technical Analysis Insights
Moving Averages Perspective
Analyzing key moving averages provides insights into short-term and long-term trends:
- Dow’s 50-day moving average: Currently at 39128 points, indicating a bullish trend as it remains above recent support levels.
- Nasdaq’s 200-day moving average: Positioned around 18000 points, suggesting a consolidation phase amid sector-specific developments and investor sentiment shifts.
Relative Strength Index (RSI) Indicators
The RSI, a momentum oscillator, offers further perspective on market conditions:
- Dow RSI: Recorded at 65, illustrating strong investor confidence and potential for continued upward momentum.
- Nasdaq RSI: Noted at 60, reflecting moderate investor sentiment amidst ongoing sector rotations and economic uncertainties.
Forecast for 28th June 2024
Dow Jones Industrial Average Projection
Based on our analysis, the Dow Jones Industrial Average is poised for continued growth supported by robust corporate earnings and favorable economic indicators. Traders may consider long positions around key support levels to capitalize on potential uptrends, with attention to 39300 resistance levels.
Nasdaq Composite Index Outlook
Conversely, the Nasdaq Composite Index faces resistance near 17858 points, influenced by market sentiment shifts and regulatory developments. Investors should remain attentive to volatility spikes and consider strategic entry points amidst ongoing tech sector innovations.
Conclusion
In conclusion, the outlook for the Dow Jones Industrial Average and the Nasdaq Composite Index on June 28th, 2024, presents opportunities for informed trading decisions. By leveraging detailed technical analysis and understanding market dynamics, investors can navigate market uncertainties and optimize their investment strategies effectively.


1win казино — популярная платформа для онлайн азартных игр. Оно предлагает широкий выбор слотов, настольных игр и ставок на спорт в удобном интерфейсе. Бонусы для новых игроков и регулярные акции делают игру выгодной и увлекательной. 1win мобильная зеркало для использования мобильного зеркала сайта 1win. Стабильная работа сайта и быстрые выплаты делают 1win привлекательным выбором для любителей азарта.
Your passion for your subject matter shines through in every post. It’s clear that you genuinely care about sharing knowledge and making a positive impact on your readers. Kudos to you!
What i do not understood is in truth how you are not actually a lot more smartlyliked than you may be now You are very intelligent You realize therefore significantly in the case of this topic produced me individually imagine it from numerous numerous angles Its like men and women dont seem to be fascinated until it is one thing to do with Woman gaga Your own stuffs nice All the time care for it up
Купить окна ПВХ в Иркутске fod38.ru
Превосходные по характеристикам и цене ПВХ окна делают здесь! Приглашаем Вас на Фабрику окон и дверей в Иркутске, чтобы заказать отличные пластиковые окна для вашей квартиры или дачи. Мы являемся создателем, поэтому у нас небольшие цены и высокое качество, на которое дается гарантия. Изготовление происходит в очень сжатые сроки, а также сборка настоящими профессионалами.
На веб сайте fod38.ru Вы найдете всю важную информацию о представленной компании, продукции, контакты и как оформить заказ. Представляем 3 варианта ПВХ окон: эконом, стандарт и премиум, где отличительной чертой будет обнаруживаться цена/качество. Выбирайте необходимый Вам вариант или получите консультацию от специалиста, какой конкретно осуществить выбор в вашем случае.
По теме окна пвх пластиковые мы обязательно Вам поможем. Окна от представленной фабрики являются экологически чистыми, так как в них не используется свинец. После монтажа, в помещениях будет тихо и уютно, а также надежно для детей, ведь мы делаем ручки с замком. Все окна с защитой от ультрафиолета, а также их просто мыть, удобно проветривать и радужно для глаз.
Если Вы искали окна пластиковые цена иркутск – то заходите на наш сайт. На сайте fod38.ru возможно оформить заказ на бесплатный замер будущих окон. Это самое верное решение, чтобы не тратить своё свободное время, потому что договор можно оформить прямо на дому. Замерщик даст ответы на любые Ваши вопросы, покажет модели и фотографии, учтет любые ваши желания и сделает точный замер с ценой.
Звоните по телефону +7(3952)656-226 или приходите в один из офисов, по адресу: г. Иркутск, ул. Лермонтова, д. 319. Режим работы с пн по пт с 9:00 до 17:30, выходной воскресенье. Будем рады установить Вам самые лучшие окна.
Hey people!!!!!
Good mood and good luck to everyone!!!!!
Dowód osobisty kolekcjonerski, prawo jazdy kolekcjonerskie i inne dokumenty kolekcjonerskie
Specjalnością naszej firmy są najwyższej klasy dokumenty kolekcjonerskie. Od wielu lat dokładamy wszelkich starań, aby każdy oferowany przez nas dowód osobisty kolekcjonerski był gwarancją odpowiedniej jakości. Naszym najistotniejszym priorytetem jest nieustanny rozwój oraz podnoszenie poziomu świadczonych usług, dzięki czemu produkowany przez nas asortyment wygląda niezwykle ciekawie i interesująco. Warto mieć świadomość, że dowód kolekcjonerski to nie fałszywy dowód osobisty i nie należy traktować go w ten sposób.Dokumenty kolekcjonerskie świetnie sprawdzają się przy okazji różnych okoliczności, chociażby w charakterze unikalnego prezentu.
Nie ulega najmniejszej wątpliwości, że każdy dowód osobisty kolekcjonerski powinien wyglądać ciekawie, w związku z czym dokładamy wszelkich starań, aby zapewniać możliwie najwyższe walory estetyczne. Należy jednak pamiętać, że dokumenty kolekcjonerskie tego typu nie mogą być używane jako fałszywy dowód osobisty. Od samego początku naszej stawiamy przede wszystkim na satysfakcję klientów. Każdy projektowany przez naszą firmę dowód osobisty kolekcjonerski wykonujemy z troską o najdrobniejsze detale.
Serdecznie zapraszamy do kontaktu wszystkie zainteresowane osoby – jeśli jesteście Państwo zainteresowani naszą ofertą, z chęcią doradzimy najlepsze rozwiązania i zagwarantujemy dowód osobisty kolekcjonerski najwyższej klasy. Kolekcjonerski dowód osobisty to doskonały sposób na zrobienie żartu najbliższemu. Wystarczy wybrać odpowiednią usługę i zdecydować się na rewelacyjny dowód kolekcjonerski.
czytaj dalej
https://forumkolekcjonerskie.com/
https://bs4shop.top/ – блек спрут онион, блек спрут онион
https://blacksprut-sait.top – спрут как попасть на сайт, блэкспрут darknet
блек спрут оригинальная ссылка – blacksprut onion, blacksprut даркнет
блэкспрут darknet – 2fa blacksprut, блэкспрут darknet
Unveiling the Power of My Medu.ir: A Comprehensive Guide for Academic Success
Meta Description: Feeling overwhelmed with academic life? My Medu.ir can be your secret weapon! This guide explores everything you need to know about this innovative platform, from its features to its benefits for students of all levels.
Introduction
Welcome, fellow scholars! Juggling academic pursuits can feel like a constant tightrope walk. Between lectures, assignments, and research, it’s easy to get lost in the whirlwind. But fear not, for a beacon of hope shines brightly in the distance: My Medu.ir.
This article, meticulously crafted by the content production unit of Zehnegahane, the leading website for academic guidance, delves deep into the world of My Medu.ir. We’ll unveil its functionalities, explore its advantages, and answer any lingering questions you might have. So, grab your metaphorical backpack, and let’s embark on this enriching journey together!
What is My Medu.ir?
My Medu.ir is a comprehensive online platform designed to empower students on their academic quests. Think of it as your one-stop shop for all things learning! It offers a plethora of resources, interactive tools, and engaging features to streamline your studies, boost your knowledge retention, and ultimately propel you towards academic excellence.
Unveiling the Features of [url=https://zehnagahane.ir/my-medu-ir/]My Medu.ir[/url]
My Medu.ir boasts an impressive array of features, each meticulously crafted to cater to the diverse needs of students. Here’s a glimpse into some of its most valuable offerings:
• Extensive Educational Content: Dive into a vast library of educational materials, including video lectures, interactive tutorials, and downloadable study guides. Whether you’re a visual learner thriving on video explanations or a kinesthetic learner seeking hands-on practice, My Medu.ir has you covered.
• Personalized Learning Paths: My Medu.ir understands that every student learns differently. That’s why it offers customizable learning paths that cater to your individual learning style and academic goals.
• Practice Makes Perfect: Sharpen your skills and solidify your understanding with a robust question bank. My Medu.ir provides a wide range of practice questions that cover various topics and difficulty levels, allowing you to test your knowledge and identify areas for improvement.
• Performance Tracking and Analytics: Gain valuable insights into your academic progress with detailed performance reports. My Medu.ir tracks your scores, identifies strengths and weaknesses, and helps you stay motivated by visualizing your achievements.
• Interactive Forums and Communities: Connect with fellow students, share experiences, and build a support network! My Medu.ir fosters a vibrant online community where you can exchange ideas, ask questions, and collaborate on projects.
The Benefits of Using My Medu.ir
Integrating My Medu.ir into your academic routine unlocks a treasure trove of benefits:
• Enhanced Learning Efficiency: Streamline your studies and maximize knowledge retention with the platform’s diverse learning materials and interactive tools.
• Personalized Learning Experience: Craft a learning journey that aligns with your individual needs and preferences.
• Improved Academic Performance: Solidify your understanding, identify areas for improvement, and witness a positive impact on your grades.
• Develop Effective Study Habits: Foster self-discipline, boost time management skills, and cultivate effective study habits that will benefit you throughout your academic career.
• Stay Connected and Supported: Find a sense of community, connect with peers, and access valuable support from fellow students and educators.
Exploring Different Use Cases for My Medu.ir
The versatility of My Medu.ir makes it a valuable companion for students across various academic disciplines and learning stages. Here are some illustrative scenarios:
• High School Students Preparing for Exams: Utilize the platform’s vast exam-specific resources to refine your test-taking skills and confidently conquer standardized assessments.
• University Students Juggling Multiple Courses: Manage your workload effectively with My Medu.ir’s personalized learning paths, integrated task management tools, and performance tracking features.
• Lifelong Learners Seeking New Skills: My Medu.ir is not limited to formal education. Whether you’re brushing up on rusty skills or seeking to acquire new knowledge, the platform’s rich library of resources can cater to your needs.
My Medu.ir: Frequently Asked Questions (FAQs)
1. Is My Medu.ir free to use?
My Medu.ir offers a freemium model. While there is a free tier with access to a substantial amount of content, premium features and functionalities might require a subscription.
Absolutely, here’s the continuation of the article on My Medu.ir:
3. Does My Medu.ir offer resources for international students?
While the primary focus of My Medu.ir is on the Iranian education system, it might offer resources and functionalities relevant to international students pursuing studies in Iran. It’s recommended to explore the platform’s content library and contact their support team for specific inquiries.
4. How do I access My Medu.ir?
Accessing My Medu.ir is a breeze. Simply visit the official website at http://my.medu.ir/ and follow the on-screen instructions to register or log in.
5. What devices can I use My Medu.ir on?
My Medu.ir is optimized for a seamless user experience across various devices. You can access the platform through your desktop computer, laptop, tablet, or even your smartphone, ensuring you can learn on the go!
6. Is My Medu.ir secure?
My Medu.ir prioritizes user data security. They implement robust security measures to safeguard your personal information.
Leveraging My Medu.ir for Academic Success: Practical Tips
To maximize your gains from My Medu.ir, consider these practical tips:
• Set SMART Goals: Define Specific, Measurable, Achievable, Relevant, and Time-bound goals for your academic endeavors. My Medu.ir’s performance tracking features can help you monitor your progress towards these goals.
• Craft a Personalized Learning Schedule: Utilize the platform’s customizable learning paths to structure your study sessions effectively. Allocate time for exploring different learning materials, practicing with questions, and engaging in discussions within the online community.
• Actively Participate in Discussions: Don’t be a passive observer! My Medu.ir’s interactive forums offer a valuable platform to engage with peers, ask questions, and share your insights. This collaborative learning approach can significantly enhance your understanding.
• Seek Support When Needed: The My Medu.ir community is there for you! Don’t hesitate to reach out to fellow students or educators for assistance with challenging concepts or to simply share your academic journey.
• Consistently Review Your Progress: Regularly analyze your performance reports generated by My Medu.ir. Identify areas where you’re excelling and aspects that require additional focus. This self-reflection will guide you in tailoring your learning approach for optimal results.
Conclusion
My Medu.ir emerges as a powerful companion for students navigating the dynamic world of academics. By harnessing its extensive resources, interactive features, and supportive online community, you can empower yourself to achieve academic excellence. So, what are you waiting for? Dive into the enriching world of My Medu.ir and embark on a transformative learning adventure!
We hope this comprehensive guide has shed light on the potential of My Medu.ir. As you continue your academic pursuits, remember that Zehnegahane, the leading website for academic guidance, is always here to support you with valuable resources and expert advice. Zehnegahane sincerely thanks you for your support until the end of this article.
[url=https://zehnagahane.ir/my-medu-ir/]مای مدیو[/url]
find this Atomic wallet
click to investigate avalanche web wallet
Блэкспрут – Kraken15, Bs.gl
ZAIM-VSEM.ONLINE — это ваш надежный помощник в получении займов на карту. Мы сотрудничаем с более чем 44 микрофинансовыми организациями, готовыми предложить займы даже при плохой кредитной истории. На сайте представлены новые и малоизвестные МФО 2024 года, где можно получить первый займ под 0% до 30 тысяч рублей.
Наши эксперты предоставляют полезные советы по правильному оформлению займов и выбору подходящей МФО. Мы делаем процесс максимально простым и быстрым, чтобы вы могли быстро решить свои финансовые вопросы. ZAIM-VSEM.ONLINE — ваш путь к быстрому займу без отказа!
Купить окна ПВХ Иркутск fod38.ru
Самые лучшие по характеристикам и стоимости ПВХ окна изготовляют тут! Хотим пригласить Вас на Фабрику окон и дверей в Иркутске, чтобы купить выдающиеся окна ПВХ для вашей квартиры или загородного дома. Мы значимся производителем, поэтому у нас небольшие цены и отличное качество, на которое дается гарантия. Изготовление происходит в максимально быстрые сроки, а также монтажная работа настоящими профессионалами.
На онлайн портале fod38.ru Вы найдете всю интересную информацию о представленной компании, продукции, контакты и как сделать заказ. Представляем 3 варианта окон: эконом, стандарт и премиум, где отличительной чертой будет обнаруживаться цена/качество. Выбирайте нужный Вам вариант или получите консультацию от профессионала, какой именно осуществить выбор в определенном случае.
По вопросу купить пластиковые окна мы обязательно Вам окажем помощь. Окна от представленной фабрики являются экологичными, так как в них не используется свинец. После установки, в помещениях будет тихо и спокойно, а также надежно для детей, ведь мы устанавливаем ручки с замком. Все ПВХ окна с защитой УФ, а ещё их легко мыть, удобно проветривать и радужно для глаз.
Если Вы планировали найти ремонт окон иркутск – то переходите на наш сайт. На сайте fod38.ru можно оформить заказ на бесплатный замер будущих окон. Это лучшее решение, чтобы не тратить своё свободное время, потому что договор можно оформить прямо на дому. Замерщик ответит на все Ваши вопросы, покажет примеры и фотографии, учтет любые ваши желания и осуществит четкий замер с расценками.
Звоните по телефону +7(3952)656-226 или приезжайте в один из наших офисов, по адресу: г. Иркутск, ул. Лермонтова, д. 319. Режим работы с понедельника по пятницу с 9:00 до 17:30, воскресенье – выходной день. Звоните, приходите, мы будем рады с Вами сотрудничать.
Я вложился в Глэмпинг Парк “Монастырская изба” и уже успел
заработать 40% годовых на перепродаже. Этот проект превзошел
мои ожидания: минимальные усилия, отличная доходность и
возможность заботиться о природе. Рекомендую всем, кто
ищет надежный и прибыльный способ инвестиций с приятными
бонусами в виде отдыха на свежем воздухе.
[url=https://glamping-village.ru/] сочи отдых в горах с бассейном
[/url]
Bs2clear – Kraken15, Bs2site
you can try here wallet avaxаа
imp source Atomic wallet
Encryption and Security: Keeping Darkweb Market’s Secrets
Surviving Scams on Darkweb: A Buyer’s Safety Guide
Darkweb Market: An Insider’s Guide to Darknet Dealings
Darkweb Darknet Market is an online marketplace on the Darknet accessible through anonymous networks such as Tor. It is one of the oldest and most reliable darknet markets, providing access to various goods and services that cannot be found on the regular Internet.
https://github.com/Dark-web-market/Darknet
посмотреть в этом разделе электрик томск
перейти на сайт электрик томск
Beat Strategies to Aid Your Restrictive Server’s Ranking
Continual a furtively server comes with its challenges, and limerick of the biggest is attracting and retaining players. Ranking stiff on private server voting sites like Xtremetop100 and TopG can significantly raise your server’s visibility and competitor base. At Cover100Franchise, we specialize in boosting your server’s ranking to guard you get the shipping you deserve.
https://top100vote.com/
Conception the Importance of Ranking
Why does ranking high matter? Players many times opt servers from the crown lists on voting sites, assuming these are the most stylish and reliable. A squiffy ranking not just boosts your server’s visibility but also builds reliability amidst likely players.
https://top100vote.com/
Utilizing Voting Services
Voting services are a game-changer conducive to server owners. Close using a waiting like Climb100Vote, your server can swiftly climb the ranks on big voting sites. We guarantee that your server receives consistent and high-quality votes, helping you maintain a top position. Our clients compel ought to seen up to a 90% develop in above after using our voting services.
Community Media Advertising
https://top100vote.com/
Social media platforms like Facebook and Instagram are barring tools in requital for reaching a broader audience. Sustained targeted ads can drive significant above to your server. At Excellent100Vote, we help you frame powerful ad campaigns that cart results without breaking the bank. Our low-cost, high-impact societal media ads are designed to attract the sort out players to your server.
SEO Marketing
https://top100vote.com/
SEO is crucial on improving your server’s visibility on search engines like Google. Edifice backlinks is an effective method to expel your search ranking. Our set at Top100Certify can whip up once more 100k backlinks to effect your server ranks at the top of search results in your category. This not merely drives more transport to your server but also enhances your online reputation.
https://top100vote.com/
Patronage Voting Bots
https://top100vote.com/
If your preferred voting milieu isn’t listed on our website, don’t worry. We can engender custom voting bots tailored to your needs within by a hair’s breadth 24 hours. These bots certify your server gets the votes it needs to climb the ranks, set on hollow voting sites. Scourge Unequalled100Guarantee fitting for more details on our form toll solutions.
Conclusion
https://top100vote.com/
Boosting your personal server’s ranking is indispensable with a view attracting players and growing your community. With Outdo100Show of hands’s thorough services, including voting, group media ads, SEO marketing, and tradition voting bots, you can effect better rankings on any voting site. Connection us today at Foremost100Against to learn how we can plagiarize your server reach different heights.
Продолжение
Ходячие мертвецы: Мертвый город 2023 1 сезон 1-6 серия смотреть онлайн в хорошем качестве
I visited various sites however the audio quality for audio songs current at this site is really superb.
look also at my pages and give a rating
XEvil is a straightforward, quickly and convenient program for fully automated recognition and bypass in the overwhelming majority of captchas (CAPTCHAs), without the have to have to attach any third-occasion providers.
The program Pretty much fully replaces expert services for example AntiGate (Anti-Captcha), RuCaptcha, DeCaptcher and Other folks. Concurrently, it appreciably exceeds them in recognition velocity (10 occasions or maybe more) and is absolutely free of charge.
https://socialmediatotal.com/story2596149/index-your-site-in-google-quickly SpeedyIndex google play
https://amlsing.com/thread-992798-1-1.html fast indexing of links 2
http://www.taodemo.com/home.php?mod=space&uid=344388&do=profile captcha service
http://kiragze7000.loxblog.com/post/6/A%20Review%20Of%20solving%20captcha.htm Xevil
https://socialbuzzmaster.com/story2721133/online-indexing-check speed index google
https://wik.co.kr/master4/831734 fast indexing tool free
http://kxianxiaowu.com/forum.php?mod=viewthread&tid=161103&extra= Xevil
https://amlsing.com/thread-992482-1-1.html solving captcha
@rref@=44r
оземпик российский аналог купить – дулаглутид рецепт, трулисити инструкция цена
EFT приватные читы – Лучший чит апекс, EFT софт
official source
dedicated vps
Лучшие книги в списке бизнес планирование – Книги похожие на 50 оттенков серого, Фильмы о людях, которые потеряли все
новые хайпы – работающие хайп проекты, высокодоходные инвестиционные проекты
сдать анализы адрес цены – сдавать кровь время месячных анализы, сдать анализы на онкологию
Если вы задумываетесь о сотрудничестве с Esperio, то ознакомьтесь предварительно с этим обзором. Брокер заявляет о себе, как об одном из лучших на рынке. Однако наше мнение по этому вопросу противоположное. Мы проведем подробный анализ предложений этой компании и изучим отзывы трейдеров, чтобы определить, насколько ей можно доверять.
О компании
Официальное название: Esperio;
Адрес, контакты: First St. Vincent Bank Ltd Building, James Street, Kingstown, Сент-Винсент и Гренадины;
Лицензия: нет;
Как давно на рынке: с 2021;
Услуги: трейдинг;
Условия: леверидж до 1:1000, нет ограничений по минимальному депозиту;
Торговый терминал: MetaTrader 4/5;
Активы: контракты на разницу цен.
Самые свежие отзывы о Esperio со всего интернета
Несмотря на почти что вдохновляющее название, брокер не особо смог заслужить похвалу от трейдеров, особенно российских. Впрочем, судя по официальному сайту, именно на них он и ориентируется.
Итак, автор с ником MEMFIS1990 уверяет, что никому не удастся заработать с этим брокером. Согласно его комментарию, Esperio просто не выводит деньги. Мужчина уверяет, что все положительные отзывы на официальном сайте компании — фейковые. Он советует трейдерам работать только с проверенными брокерами, а не ноунеймами.
Следующий автор с ником Raspop нашел только один положительный момент у этого брокера. В отзыве он упоминает, что Esperio не скрывает отрицательной доходности по своим портфелям. В остальном мужчина тоже не советует связываться с этой компанией. Как минимум, потому что она мало кому известна и не регулируется авторитетными надзорными органами.
Не все трейдеры оказали столь осторожными, чтобы не торговать с Esperio. Автор следующего отзыва потерял 2 тысячи долларов на этой платформе. Он пополнял счет через систему WebMoney. К сожалению, обращение к юристам не решило вопрос, процедура чарджбэка в этом случае оказалась недоступной. Клиенту пришлось смириться с потерей, так как все его обращения Esperio все равно проигнорировал.
Еще одна девушка вообще описывает в отзыве порядок работы Esperio. Александра утверждает, что представители компании ищут потенциальных клиентов в социальных сетях. Изначально будущим жертвам предлагают работу, а именно, простое заполнение Excel таблиц. Потом их уговаривают приобрести курс обучения не менее чем за 50 тысяч рублей, и, наконец, самим начать торговлю на платформе Esperio. Естественно, все заканчивается сразу после пополнения. Аналитики, советующие открывать сделки, скорее рано, чем поздно, загоняют депозит трейдера в ноль.
Подтверждает слова Александры Виктория. Она называет Esperio самым ужасным местом работы. Девушка пишет в отзыве, что после месяца оплачиваемой стажировки ей, в конце концов, ничего не перечислили. Зато она регулярно терпела оскорбления от руководства. Виктория не скрывает, что главной ее обязанностью был холодный обзвон и развод людей на деньги.
Признаки обмана, мошенничества
Когда реальные отзывы настолько отличаются от тех, что брокер размещает на своем официальном сайте, вывод очевиден. Вряд ли перед нами честный и прозрачный посредник. К тому же, мы нашли и другие спорные моменты.
Срок существования проекта
Трейдеров пытаются убедить в том, что Esperio появился в отрасли еще в 2012 году. Это утверждение можно прочесть в коротком описании самой компании, и заметить в футере сайта. Однако ничего общего с реальным положением вещей такие заявления не имеют. В отзывах авторы пишут об отсутствии узнаваемости бренда не просто так. До недавнего времени о таком посреднике никто не знал.
Данные веб-архива показывают, что брокер занял сайт в июне 2021 года. В самом деле, сложно представить, чтобы за 10 лет работы действительно надежный брокер так и остался для большинства трейдеров неузнаваемым.
Регистрация
С юридическими данными у Esperio вообще произошла какая-то путаница. Брокер указывает в качестве управляющей компании некую OFG Cap LTD. При этом в реестр Сент-Винсент и Гренадин она должна быть внесена под номером 20603. Разумеется, мы не нашли ни одного упоминания о таком наборе цифр.
Но хотя бы OFG Cap, правда, не LTD, а LLC все-таки существует. Кстати, она была инкорпорирована в 2022 году, даже позже, чем появился официальный сайт. Уж совсем никак не в 2012. В футере указана недостоверная информация.
Добавить ко всему перечисленному стоит и то, что гренадинский офшор — не самое лучшее место в мире для регистрации бизнеса. Вернее, для мошенников, конечно, сойдет. А вот у клиентов, особенно трейдеров, могут возникнуть существенные проблемы при сотрудничестве с такими компаниями.
Отсутствие документов
Назваться брокером недостаточно. Esperio было бы неплохо еще получить официальное разрешение на свою деятельность. Но Сент-Винсент и Гренадины как раз предпочитают те посредники, которым не хочется думать о лицензиях. FSA (регулятор в этой юрисдикции) не выдает подобным онлайн дилинговым центрам лицензии. И вообще он не ведет никакого надзора за их деятельностью.
На главной странице регулятора так и написано, что внесение в реестр — это не гарантия хорошей репутации компании. Российский Центробанк, например, вообще заблокировал сайт Esperio и внес фирму в черный список.
Выводы
Esperio зарегистрирован в офшорной зоне Сент-Винсент и Гренадин, что означает отсутствие контроля со стороны государственных органов. Кроме того, у него нет лицензии на осуществление брокерской деятельности. Торговать на таких площадках не стоит. Это легко обернется потерей капитала.
Home Page crazy pachinko evolution
their website
undetect cheat Valorant
great site wasabi wallet
changan официальный – faw t99, chery официальный дилер в москве
smart game booster 5.2 pro crack – aim download, fortnite skin swapper download
онлайн казино – пин ап официальный сат, пин ап
https://rem-72.ru/remont-kvartir-v-ximkax/
Позолоченный век (2022) смотреть сериал онлайн бесплатно – новинки кино 720, смотреть фильмы онлайн бесплатно новинки
Credit Card BIN list – Debit Card, BIN checker
영어를 제대로 구사하지 못하고 현지 법률에 익숙하지 못하니 자격만 있을 뿐 엘에이 비자 변호사로서의 역할을 할 수 없는 것이다. 반면 뛰어난 언어 실력과 현지 미국법에 대한 능숙하고 깊은 인지를 바탕으로 ‘제대로 뛰는 미국 변호사’도 있게 마련이다. 이영선 변호사는 최대로 마지막에 속하는 변호사다.
[url=https://xn--6l3bu5e0rf5a09pbt1b.com/]엘에이 결혼 변호사[/url]
Automatic Social Media Services – Affordable Social Media Marketing, Cheap SMM Panel
Archetyp Market
https://github.com/MarketArchetyp/Link
click this site glory casino bangladesh
эскорт услуги москва – эскорт москва, эскорт мск
vip эскорт москва – элитный эскорт в москве, эскорт мск
Три года назад я вложил деньги в дом в глэмпинг-отель [url=glamping-park.com]сайт проекта[/url], и теперь хочу поделиться своей радостью. За это время моя инвестиция полностью окупилась! Я не только наслаждаюсь природой и комфортом, но и получаю стабильный доход. Это был один из лучших решений в моей жизни!
[url=https://glamping-lodge.ru/]эко отель красная поляна[/url]
vip эскорт москва – элитный эскорт в москве, элитный эскорт в москве
check my site trader joe
здесь снюс оптом
next coinmarketcap
[url=https://pint77.com] Pinterest advertising for the USA and English-speaking countries. Etsy, amazon, shopify, ebay[/url]
vps server hosting price – linux vps hosting, storage vps hosting
check out this site 1win bet
Построить дом из кирпича – Построить дом, Построить дом из кирпича
YOURURL.com pinup
https://kinozapas.ac/
оземпик препарат инструкция +по применению – +что +за лекарство аземпик, аземпик курить
Помогаем получить второе гражданство или стать резидентом в разных странах мира. Смотрите [url=https://www.youtube.com/watch?v=R4GyGl7X07E][b]вступительное видео[/b][/url]:
https://www.youtube.com/watch?v=R4GyGl7X07E
Второе гражданство, Практическая иммиграция, Иммиграция, Вид на жительство, ВНЖ, Зелёная карта
Гражданство Евросоюза под ключ
Гражданство на основании корней
Гражданство Армении под ключ
Гражданство Кыргызстана под ключ
Гражданство Гражданство Польши под ключ
Гражданство Болгарии под ключ
Гражданство Италии под ключ
Гражданство Греции под ключ
Гражданство Израиля под ключ
https://libertyfintravel.ru/vnj-i-vtoroe-grajdanstvo
Source Rufus download
ohgodanethlargementpill-r2 – Скачать OhGodAnETHlargementPill, Как создать RVN кошелёк
check these guys out
campeon
найти это https://battlepass.ru/service/mobile_legends
here
la cienaga
page Tor browser download
препараты +для похудения самые – оземпик купить без рецепта, мунжаро купить препарат
mounjaro препарат – mounjaro отзывы, где купить мунджаро
Solve any problems with cryptocurrency – The old crypto exchanger on the new site, They don ‘t care about sanctions, they will withdraw your dirty money
камин дровяной – настенные электрокамины купить в интернет магазине, купить биокамин в москве недорого
продолжить https://kp-inform.ru/catalog/diski_hpe/zhestkiy-disk-864262-b21
additional info Your Hub for Free Software Downloads
read what he said https://crazy-pachinko.com/
узнать больше обменник криптовалют
создание веб сайта – заказать создание сайта, запуск таргетированной рекламы
Бельё для женщин включая женские майки и топы всех необходимых размеров, брендов и типов. https://incanto.com.ua/stringi – трусики и бюстгальтеры, удобное и мягкое для тела ежедневно стоит купить в бутике. Женщинам всех возрастов хочется быть уверенной в себе. Такие изделия помогут реализовать это и помочь стать неотразимой. Среди вариаций нательных творений: бюстгальтеры бралет, балконет и push-up, с чашкой уплотненной и мягкой, эксклюзивные и соблазнительные, привлекательные трусики макси и слип, игривые бразилиана и открытые стринги, с нежной тканью или плотные. Подходящий по размеру и вкусу женского белья или бюстгальтер и трусики – это возможность выделить свои достоинства, возыметь уверенность в своей природной красоте, ощутить себя в новой роли. У женского нижнего белья есть определенные тенденции и тренды, которые постоянно меняются, адаптируясь под требования и ожидания женщин. Так выясним же, что будет популярно в этом году.
a hired assassin safely – gunman, american assassin
Инвестируйте в Деревья, как Билл Гейтс!
Билл Гейтс инвестирует в сельское хозяйство, и вы можете
последовать его примеру. Одно дерево приносит $160 дохода в год,
а владение 1000 деревьев может дать вам $80,000 в год!
Преимущества:
– Высокая доходность: Увеличение стоимости дерева на 15-20%ежегодно.
– Урожай и масло: До 39% годовых от продажи оливкового маслаи урожая.
– Быстрая окупаемость: Возвращение инвестиций за 2-4 года.
Не упустите шанс! Инвестируйте в деревья и наслаждайтесь
стабильным доходом. Ваш успех в ваших руках!
[url=https://gpolivegroup.com/] морская симфония 2 сочи
[/url]
продолжить электрик томск
look these up Atomic wallet
[b]Best cardsharing service, iptv[/b] cheap price [b]only 0.99$[/b]
[b]CARDSHARING[/b]
https://iptv.utgard.tv ]IPTV 0.99$
[b]Стабильный качественный[/b]
[b]кардшаринг[/b] +
https://iptv.utgard.tv IPTV
по самым низким ценам в сети, всего [b]0.99[/b]$
Наш форум https://telstar.su
Лазерный уровень, или нивелир, — это инструмент, предназначенный в первую очередь для выравнивания объектов относительно горизонтальных, вертикальных и наклонных плоскостей.)- [url=https://dtk-m.ru/polezno-znat/lazernyj-uroven-sovremennyj-instrument-dlya-tochnyh-izmerenij/]лазерный уровень.[/url]
Combining wrist joint flexibility with hand 人形 えろpalm movement, this option enables the doll’s wrist to pivot 90 degrees forward and backward, significantly expanding its range of motion.
and one gets the makings of a cycle.To break that cycle we have to address the parenting,リアル ドール