Unveiling Support and Resistance Levels: A Comprehensive Analysis of NVDA Stock
Introduction:
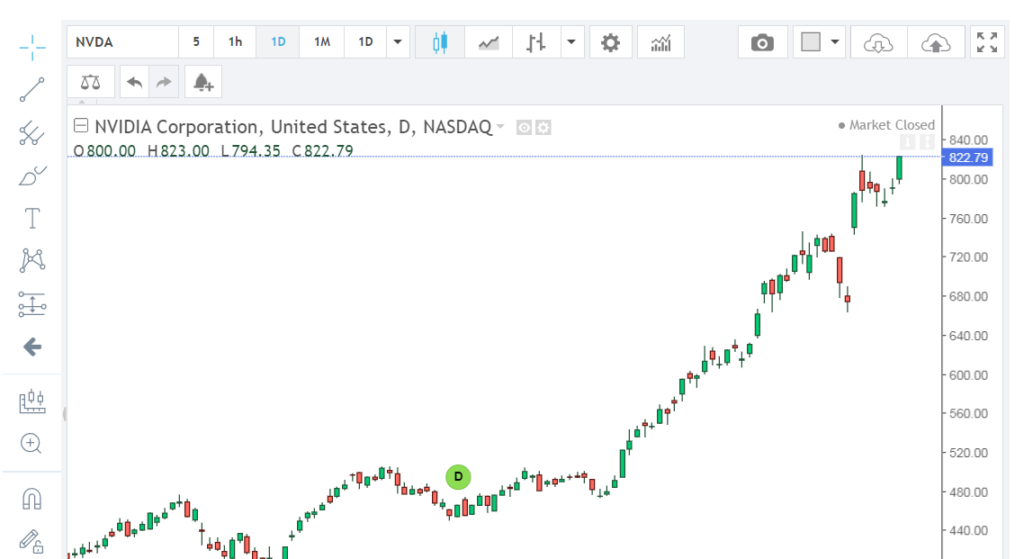
NVIDIA Corporation (NASDAQ: NVDA) is a leading semiconductor company known for its graphics processing units (GPUs) and artificial intelligence (AI) technologies. Analyzing support and resistance levels is crucial for understanding NVDA’s price action and identifying potential entry and exit points for traders and investors. In this analysis, we’ll delve into the key support and resistance levels for NVDA stock, utilizing both technical analysis tools and fundamental insights.
Support and Resistance Levels:
Support and resistance levels are critical technical indicators that help traders identify levels where buying or selling pressure is likely to emerge. Support levels represent price levels where demand for the stock is expected to prevent further declines, while resistance levels denote price levels where selling pressure may cap further upside movements.
Technical Analysis:
1. Support Levels:
– The $200 level has historically acted as a strong support level for NVDA stock. This psychological level often attracts buying interest from investors looking to accumulate shares at a perceived discount.
– The 200-day moving average (DMA) also serves as a significant support level. The 200 DMA is a long-term trend indicator, and NVDA’s price tends to bounce off this level during uptrends, signaling potential buying opportunities.
– Previous swing lows and consolidation zones, particularly around $180-$190, may provide additional support levels. These levels represent areas where buyers have previously stepped in to defend NVDA’s price.
2. Resistance Levels:
– The $350 level has acted as a formidable resistance level for NVDA stock in recent months. This level represents a psychological barrier for investors and may trigger profit-taking or selling pressure.
– All-time highs around $380-$390 serve as major resistance levels. Breaking above these levels would signal a bullish continuation and could attract momentum traders and institutional buyers.
– Trendline resistance drawn from previous peaks can also provide valuable insights into potential resistance levels. Traders often monitor trendlines to gauge the strength of the prevailing trend and anticipate potential reversals.
Fundamental Analysis:
In addition to technical analysis, fundamental factors can influence NVDA’s support and resistance levels:
– Earnings Growth: Strong earnings growth and positive guidance can bolster investor confidence and support higher price levels. Conversely, disappointing earnings reports may lead to downward revisions in price targets and act as resistance.
– Market Sentiment: Investor sentiment towards the semiconductor industry, technological innovation, and macroeconomic factors can impact NVDA’s support and resistance levels. Positive industry trends and favorable market conditions may lift NVDA’s stock price, while negative sentiment could weigh on performance.
– Product Developments: NVIDIA’s product pipeline, including advancements in gaming GPUs, data center solutions, and AI technologies, can drive investor enthusiasm and influence support and resistance levels. Key product announcements, partnerships, or regulatory approvals may act as catalysts for price movements.
Risk Factors:
It’s essential to consider potential risk factors that could impact NVDA’s support and resistance levels:
– Market Volatility: High volatility in broader equity markets or sector-specific volatility in the semiconductor industry can amplify price fluctuations for NVDA stock, challenging support and resistance levels.
– Macroeconomic Headwinds: Economic uncertainties, geopolitical tensions, inflationary pressures, or changes in interest rates may disrupt market dynamics and influence investor behavior, affecting NVDA’s price trajectory.
– Competitive Landscape: Intensifying competition from rival semiconductor companies, technological disruptions, or shifts in consumer preferences could pose challenges for NVDA’s growth prospects and support/resistance levels.
Conclusion:
In conclusion, analyzing support and resistance levels is essential for understanding NVDA’s price dynamics and formulating effective trading strategies. By combining technical analysis with fundamental insights, traders and investors can identify key levels where buying or selling pressure is likely to emerge. However, it’s crucial to remain cognizant of potential risk factors and adapt to evolving market conditions to navigate NVDA’s price movements successfully.